Code Errors
Scenario 3: Something in the logic of your code causes your application to not compile, or it causes the application to crash when the piece of code is executed.
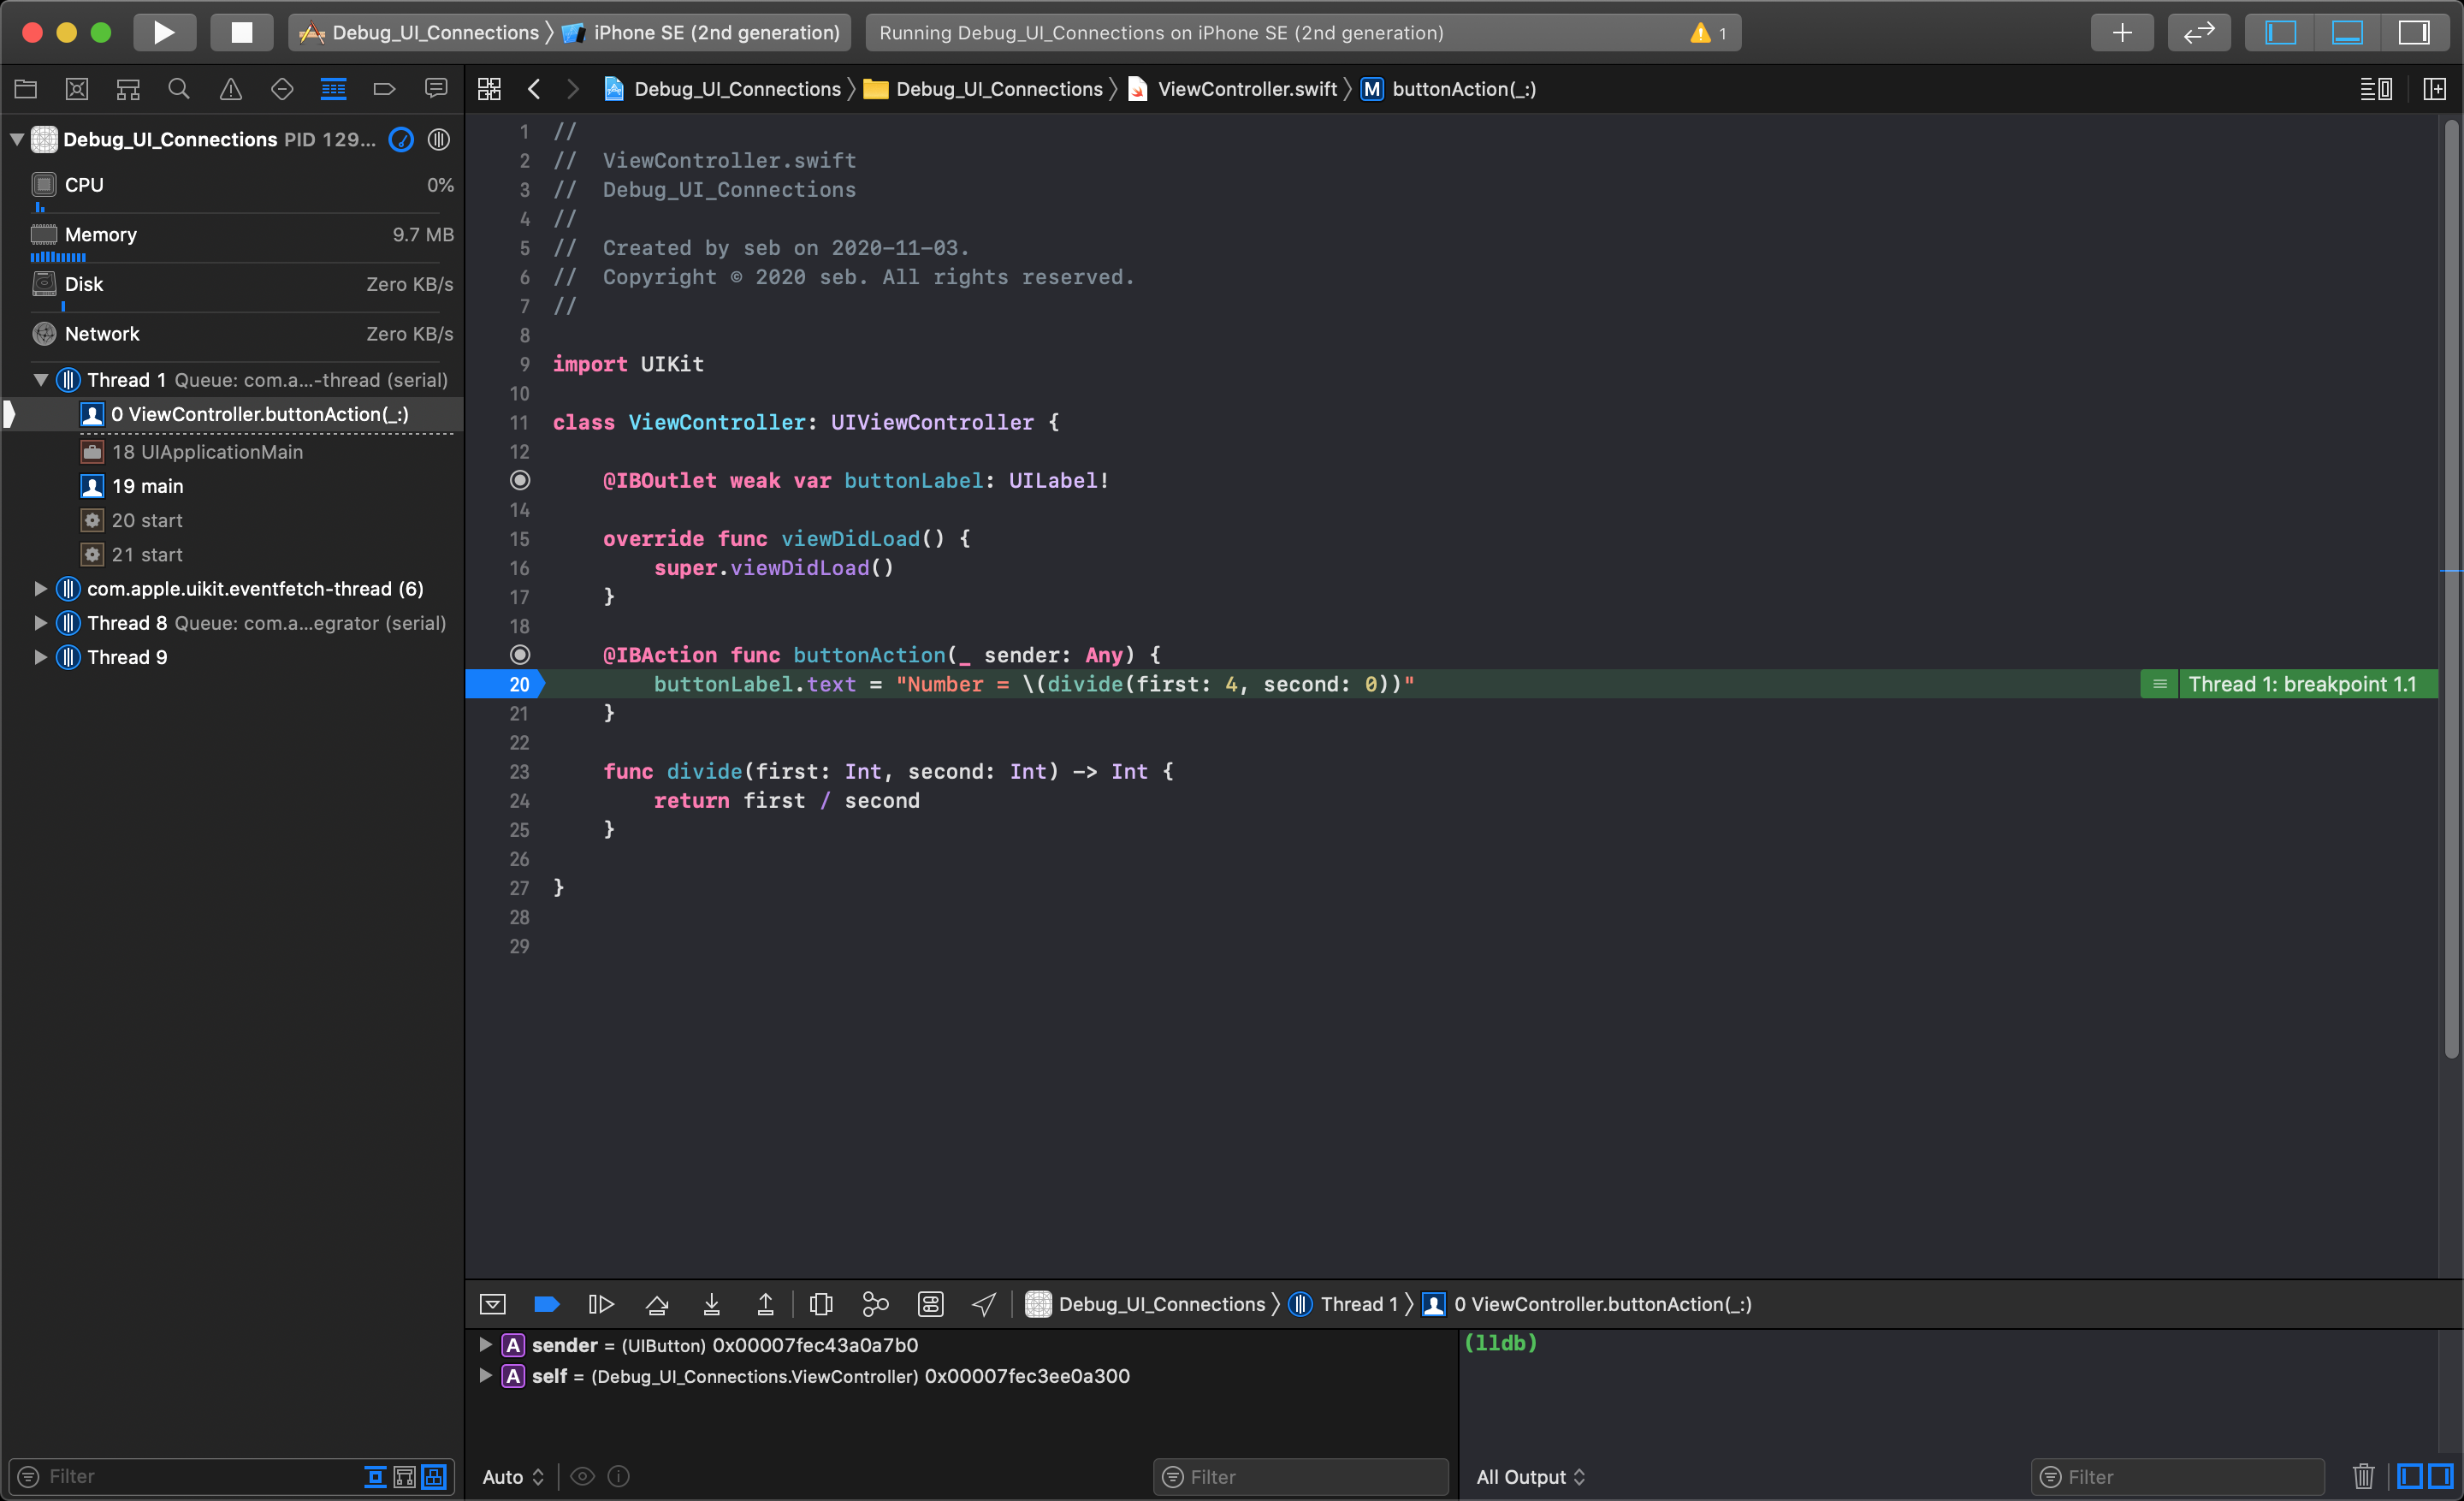
If we look at the example project below, we can see that this application will compile and run in the simulator without errors.
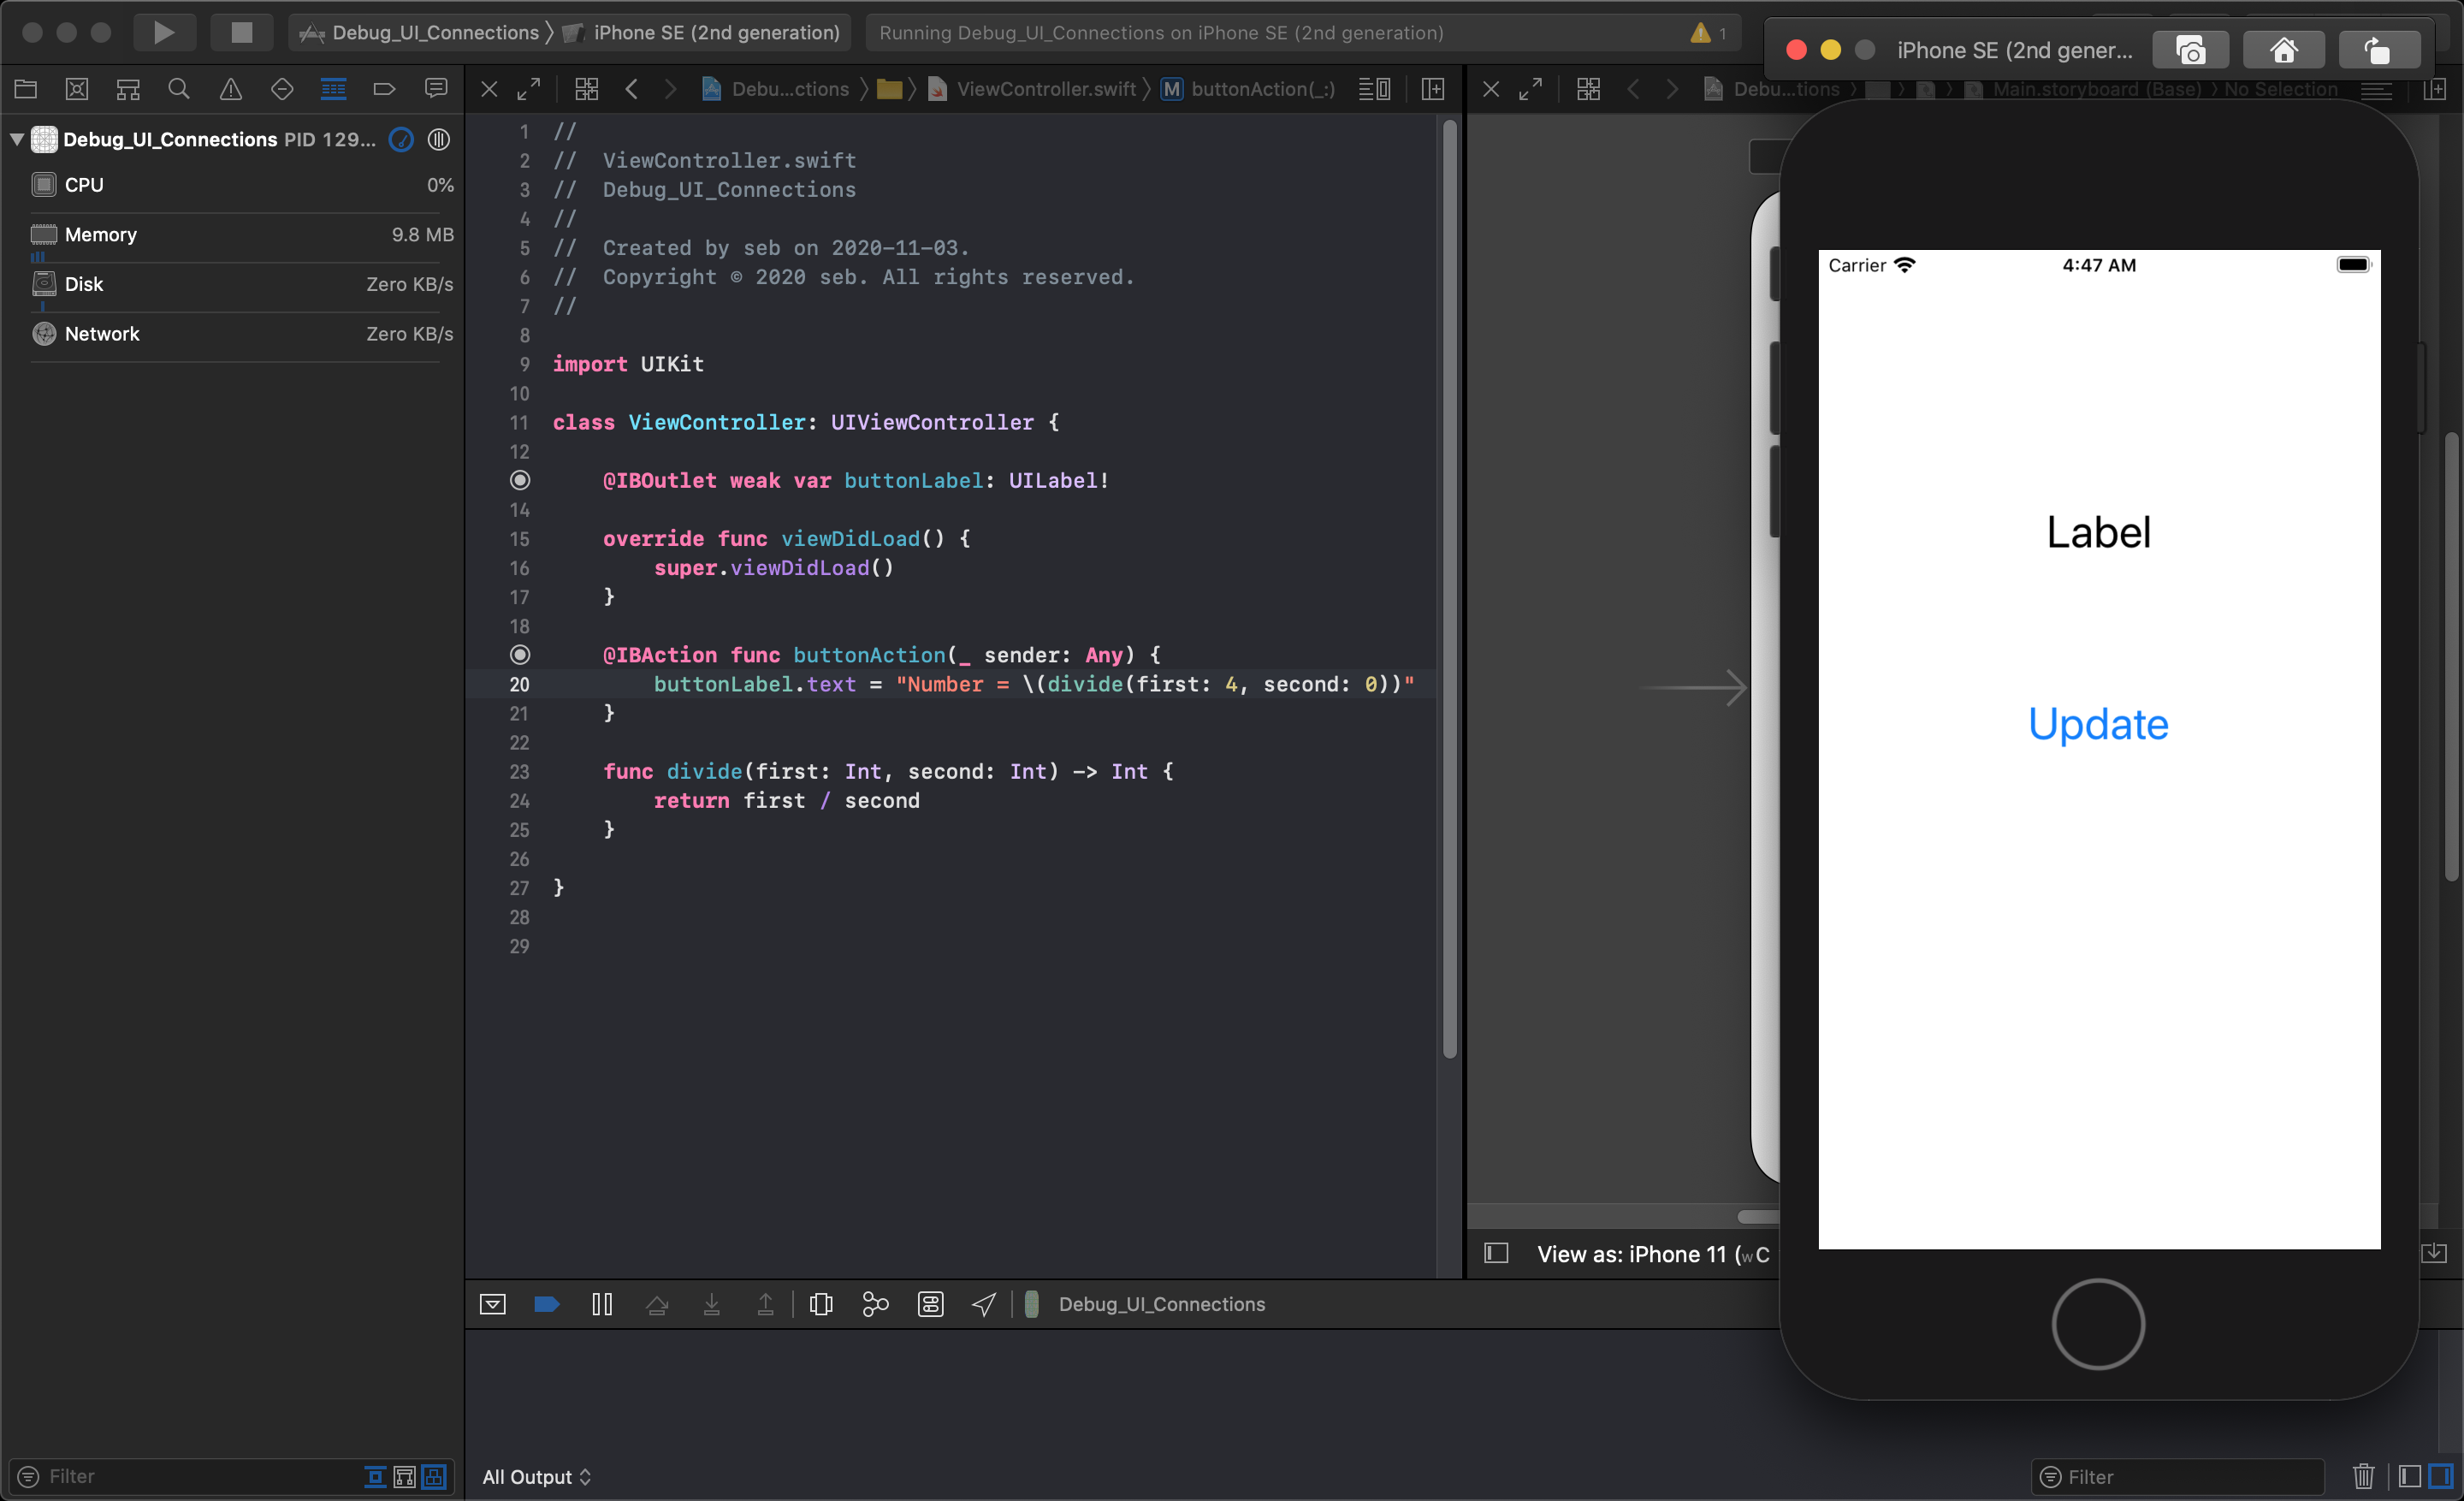
When the button's action calls the divide function, the application crashes because dividing an integer by 0 is undefined. In this case, we see a function that has two integer values — first and second — passed into it and then returns the result of dividing the first number by the second.
Unfortunately, we can not see where the second number is being passed a value of 0. To debug this problem, we need to work backwards from the line of code that caused the crash until we find what generated this bug.
In this simple example the error might seem obvious, but when you have many swift files and hundreds or thousands of lines of code in your project, hunting down the cause of a crash can seem difficult.
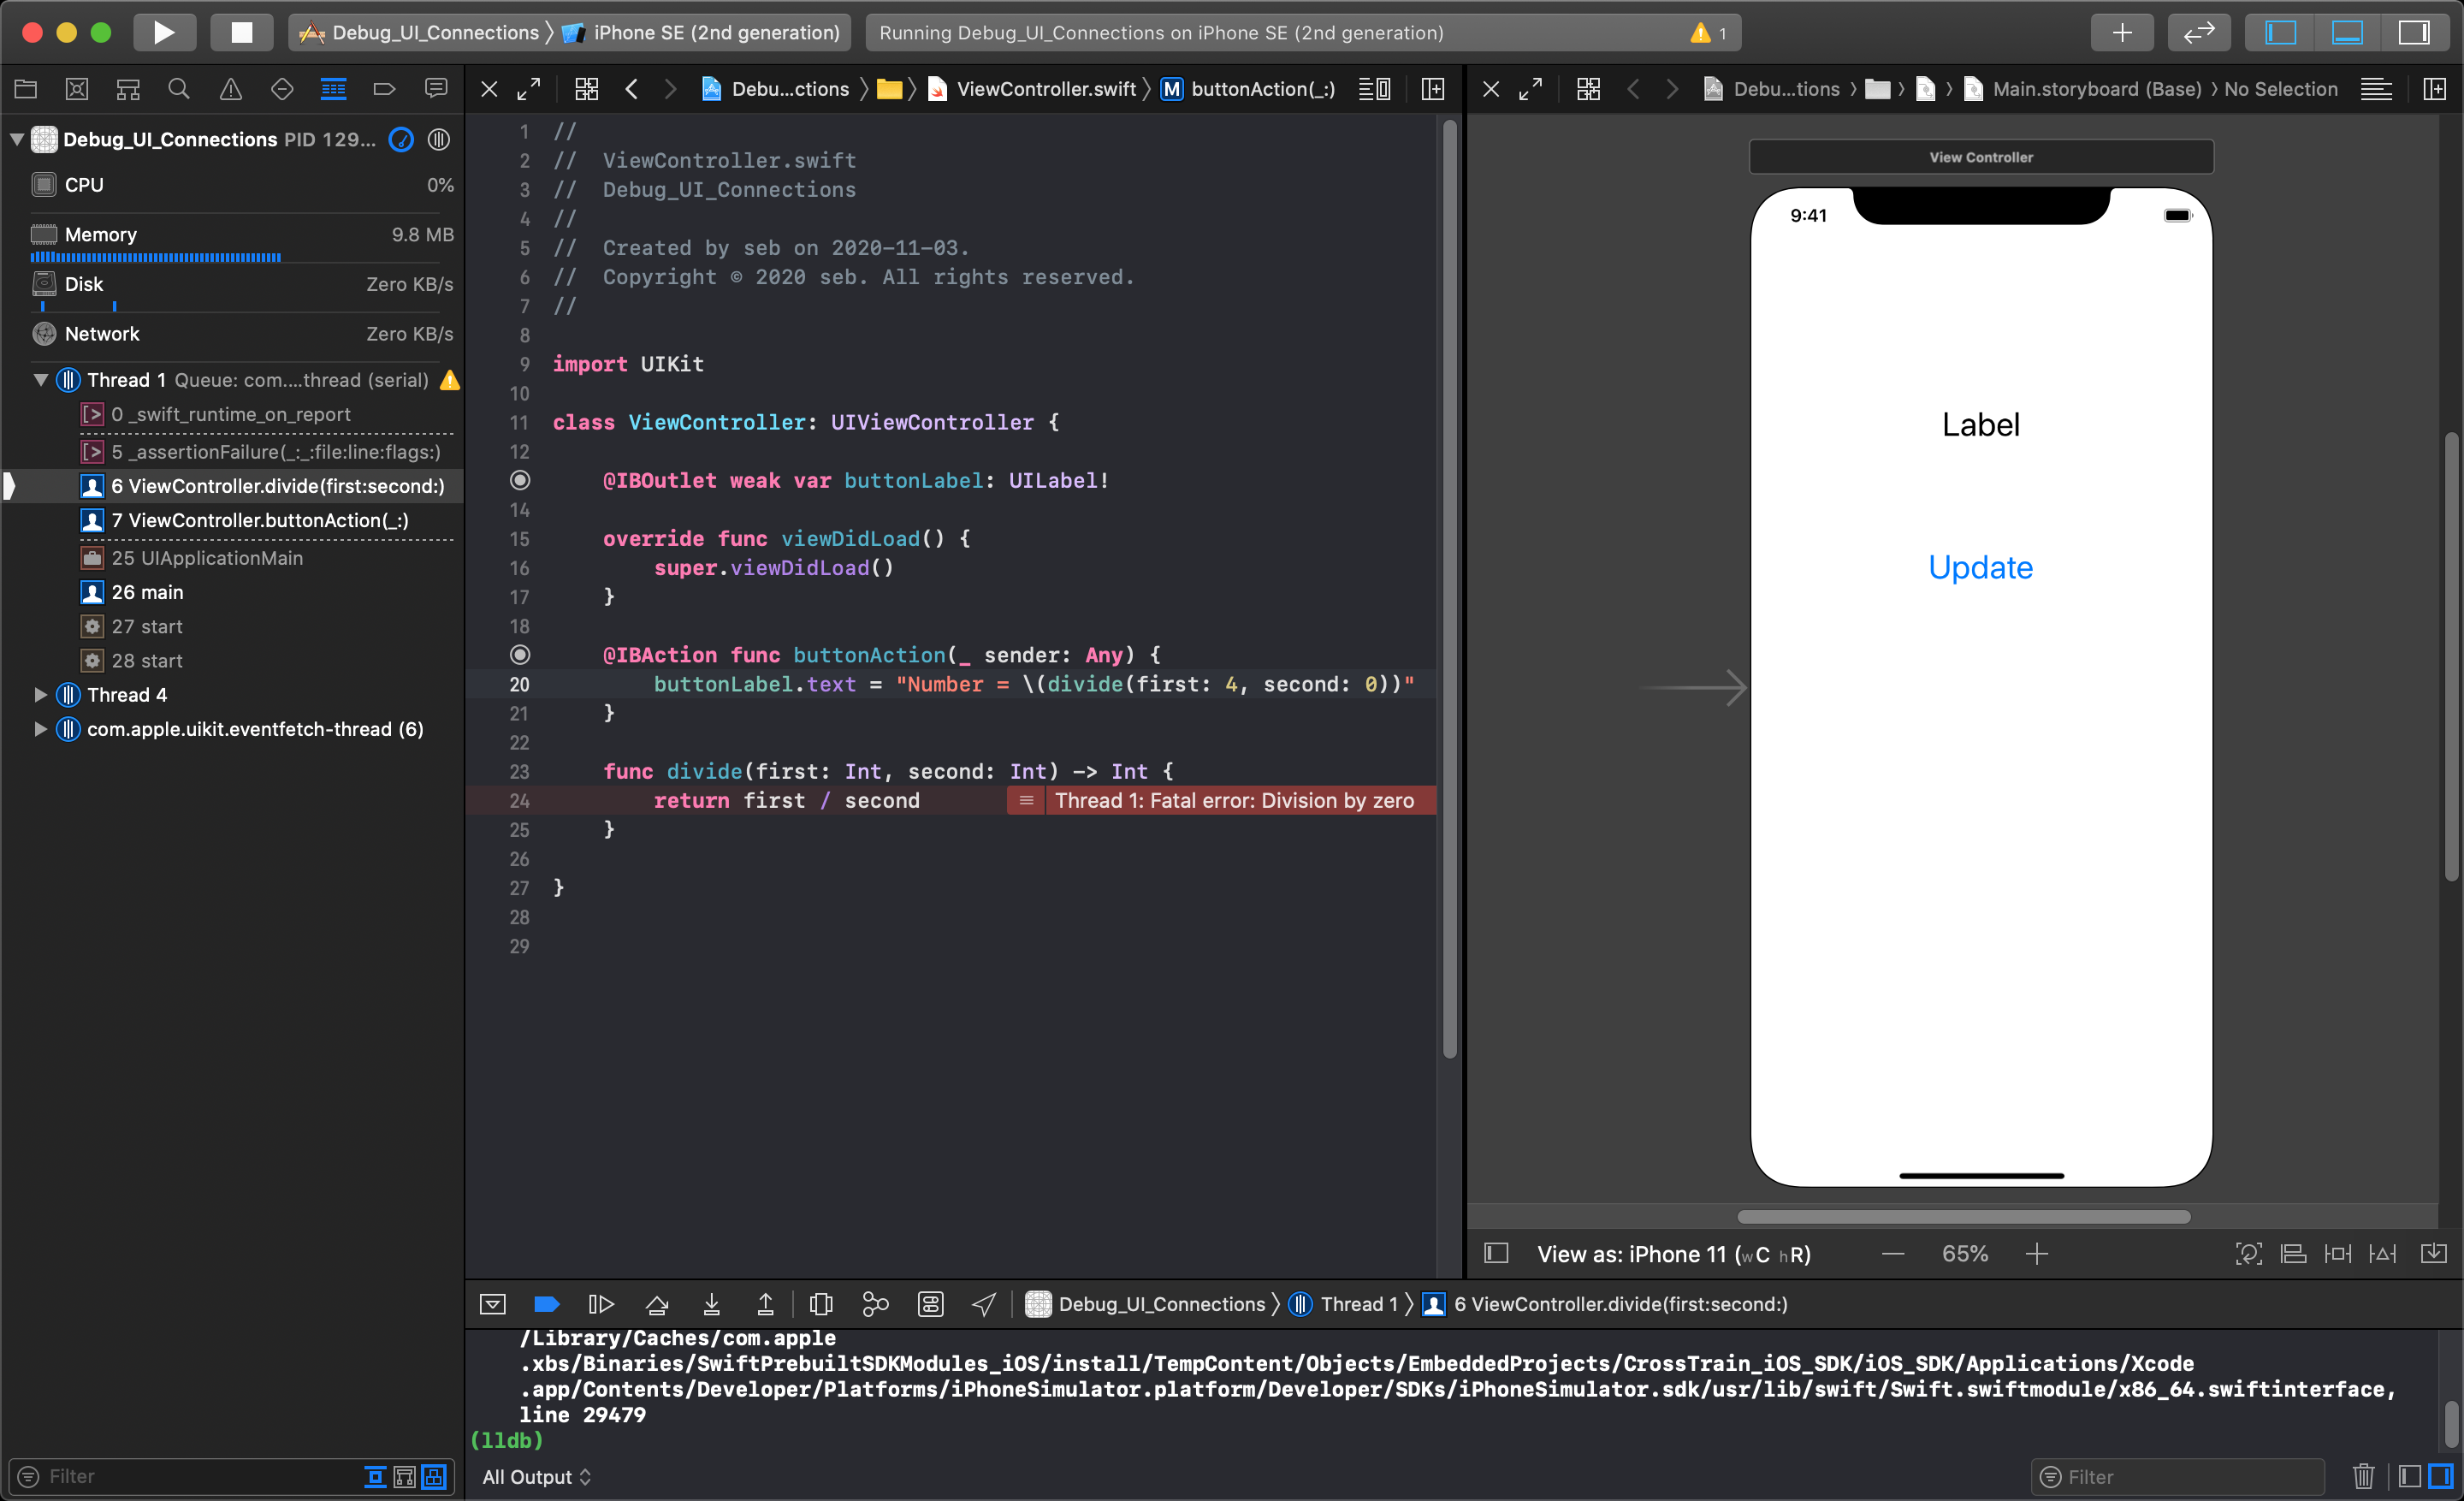
You should always look for helpful information printed in the console (or in the red pop-ups in your code) to look for suggestions of how to fix the bug. This example has a red error message on line 25 of the code in the editor that says:
Thread 1: Fatal Error: Division by zero
This means somewhere in the code the this function's second parameter is being set to a value of 0. To verify this you can open the Variables View beside the console at the bottom right hand corner of Xcode in the image above.
Using Break-Points
To solve errors in your code like this, you must learn to use break-points and the Variable View to check the state of your variables while your application is running, and when it crashes.
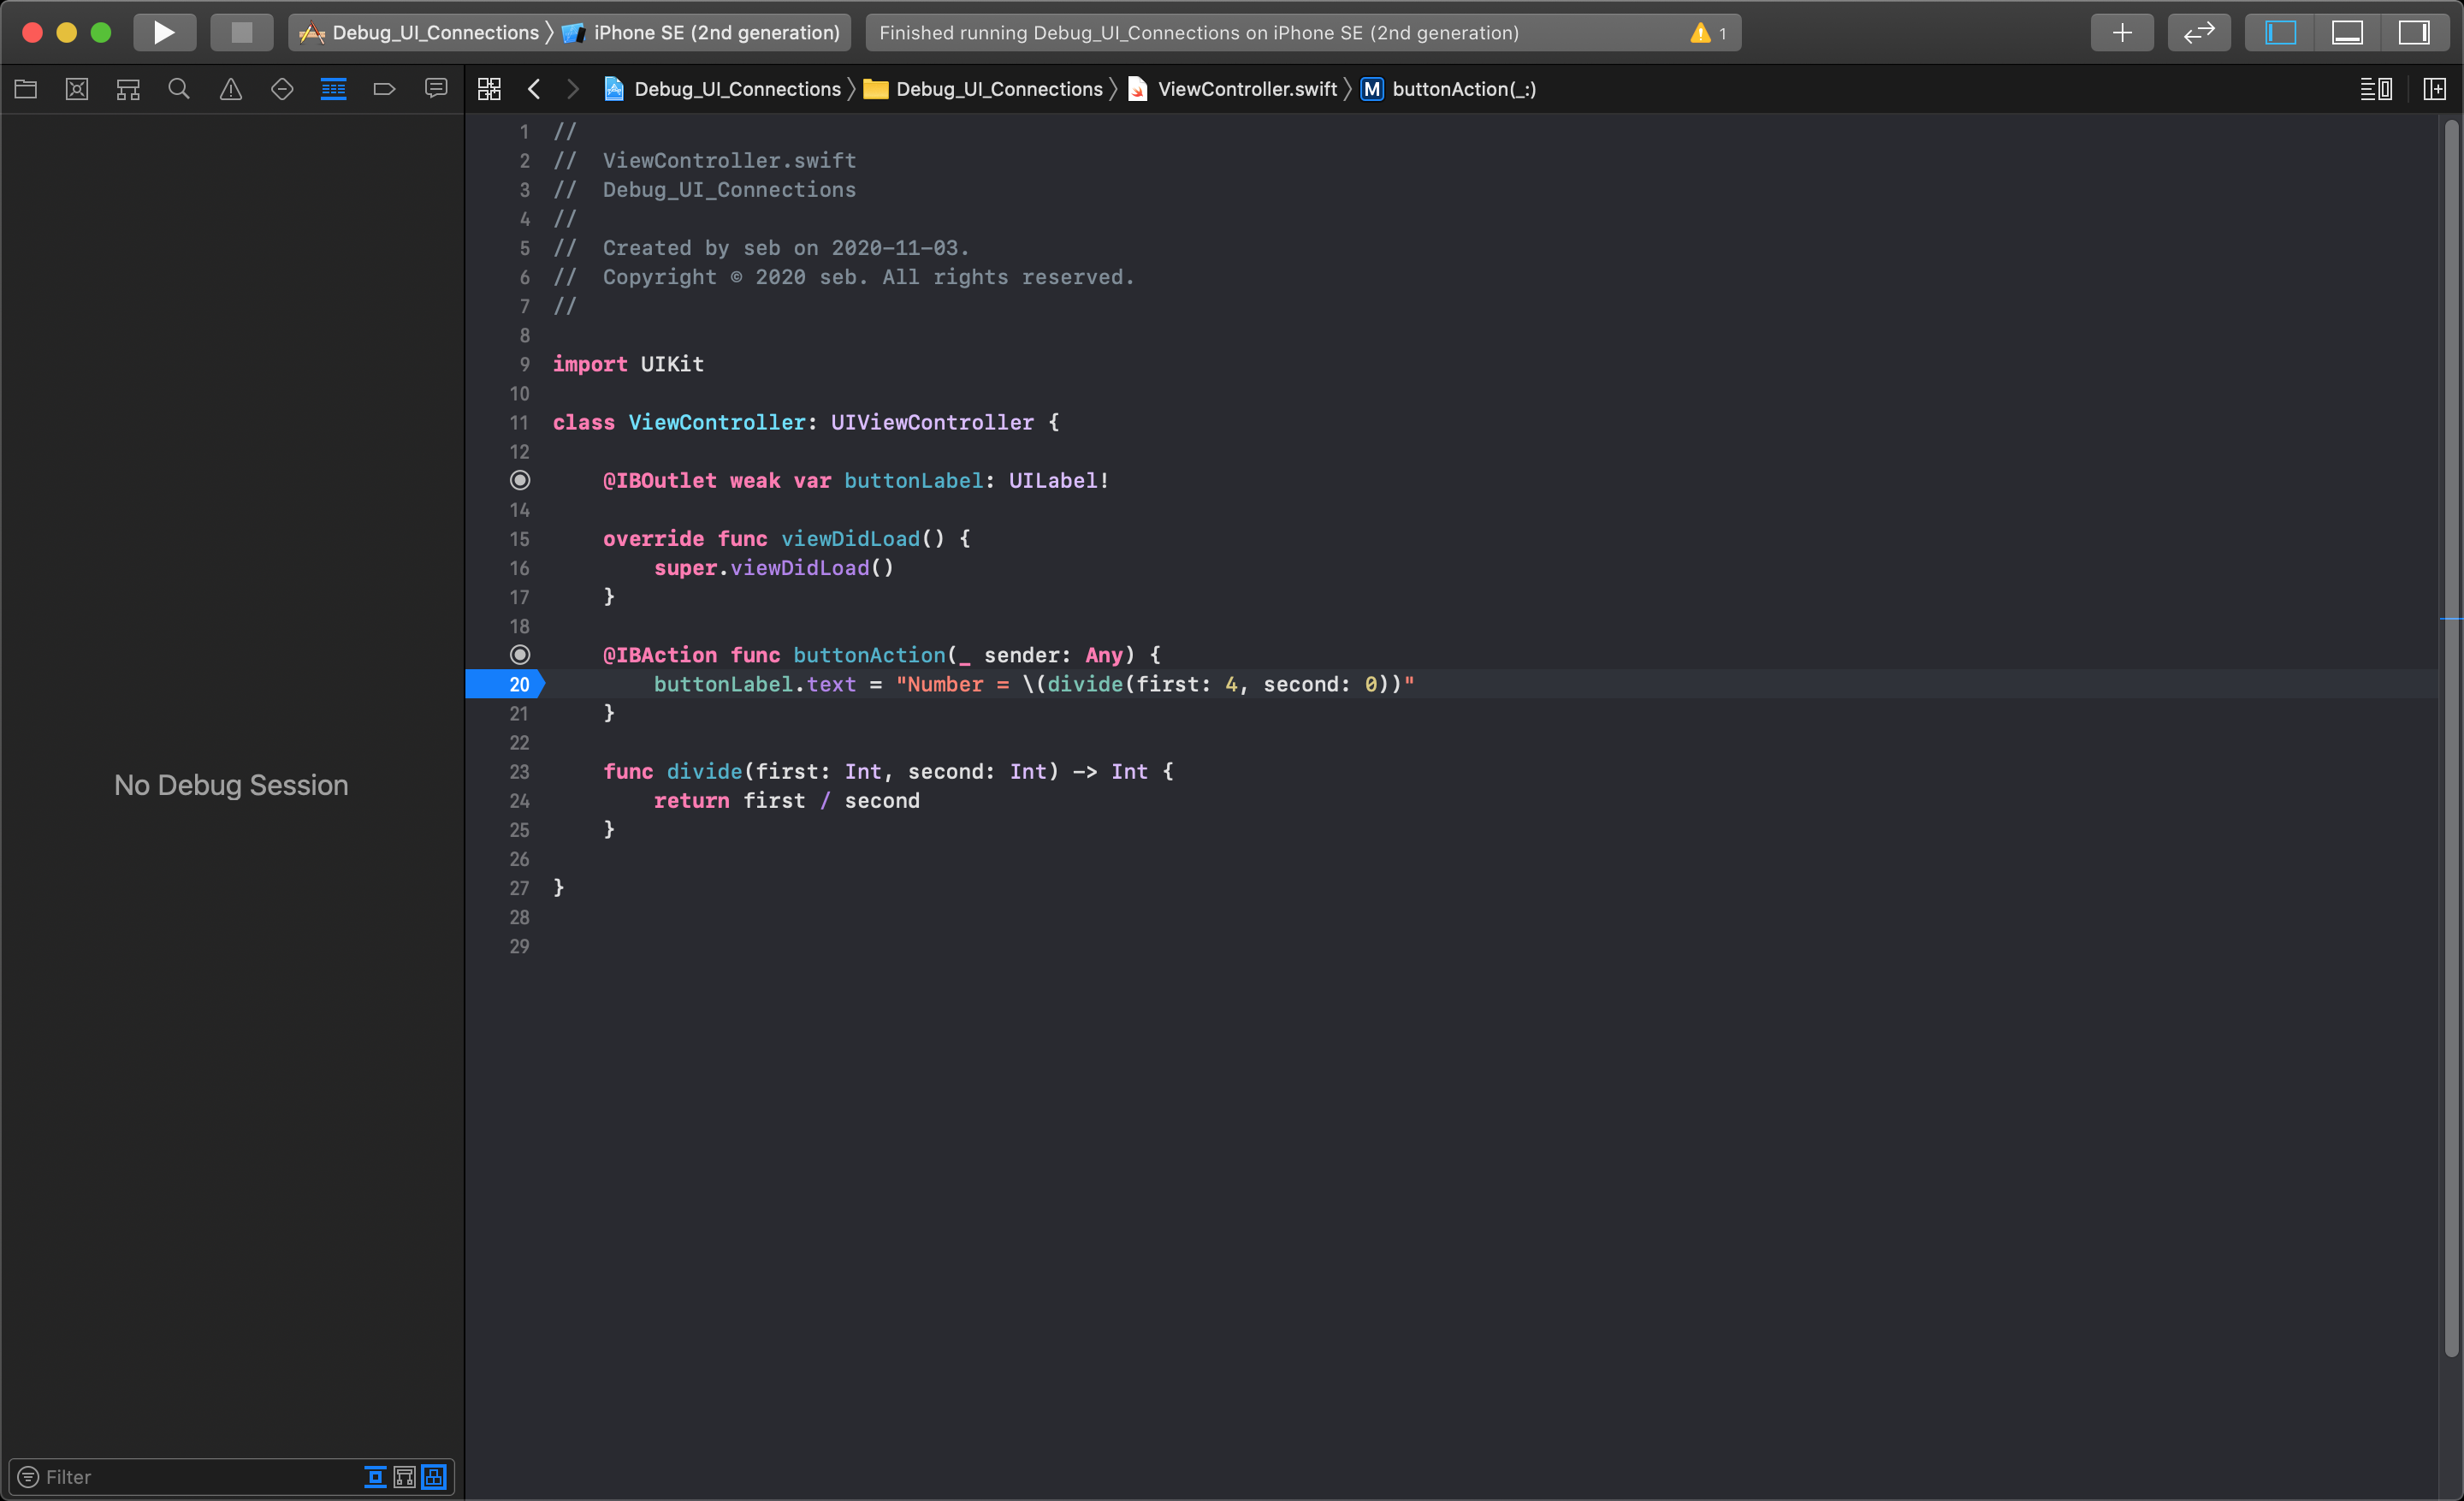
We must experiment with adding a break point to a line of code somewhere before the line that is causing the crash. Below you can see that we have added a break-point to line 21 of the code by clicking on the line number.
TIP
To learn how to display line numbers in the left gutter of your code, look at Week 1: Customizing Xcode.
Adding a break-point to any line of code will cause the execution of your application halt as it tries to execute that line.
In this case, whenever the button is pressed, the break-point will be triggered and the program will pause at the break-point before the crash occurs.
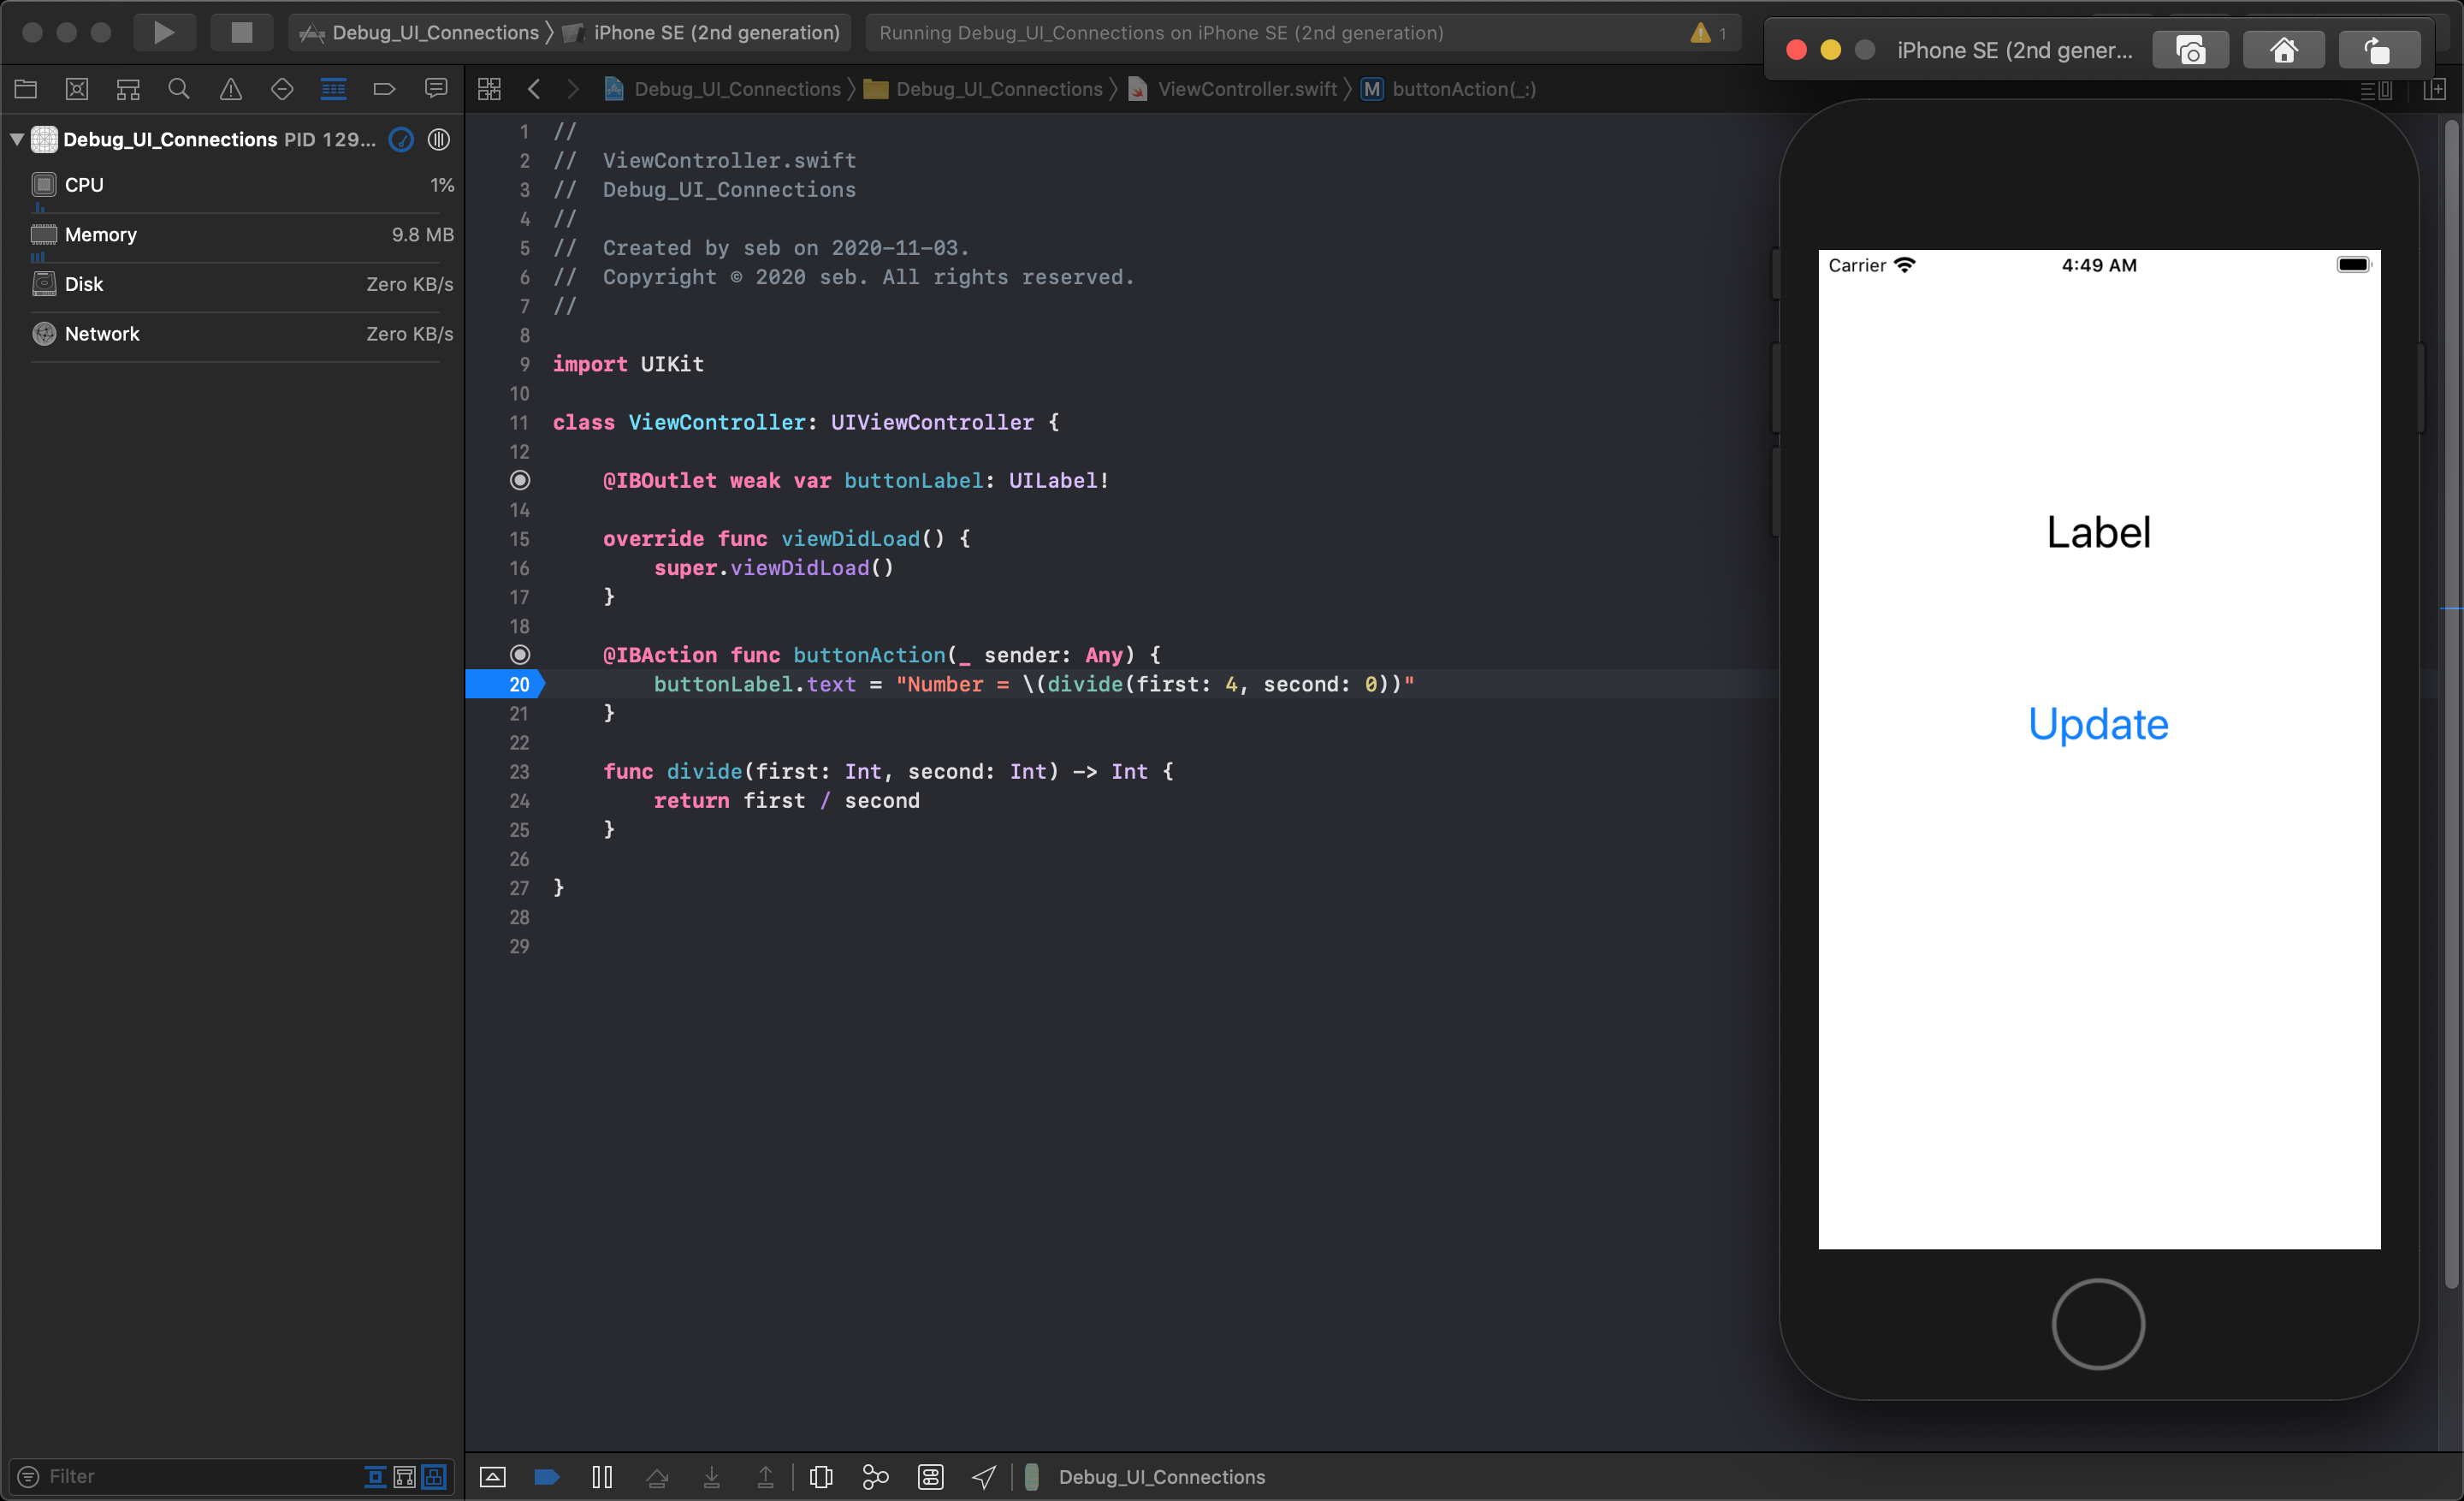
The break-point pauses the application, letting you go in to the debugger and inspect each current variable and object in memory and see what they are set to. You can now control the execution of your application and step into — and through — the lines of code that come after the break point up until the line of code that causes the crash. In this example we had the application crash in the divide function, so we decided to place our break-point on the line of code that calls the divide function.
When a break-point halts your application you can choose to advance in your code by 'Steps' or you can simply Continue your application as normal from the break-point.
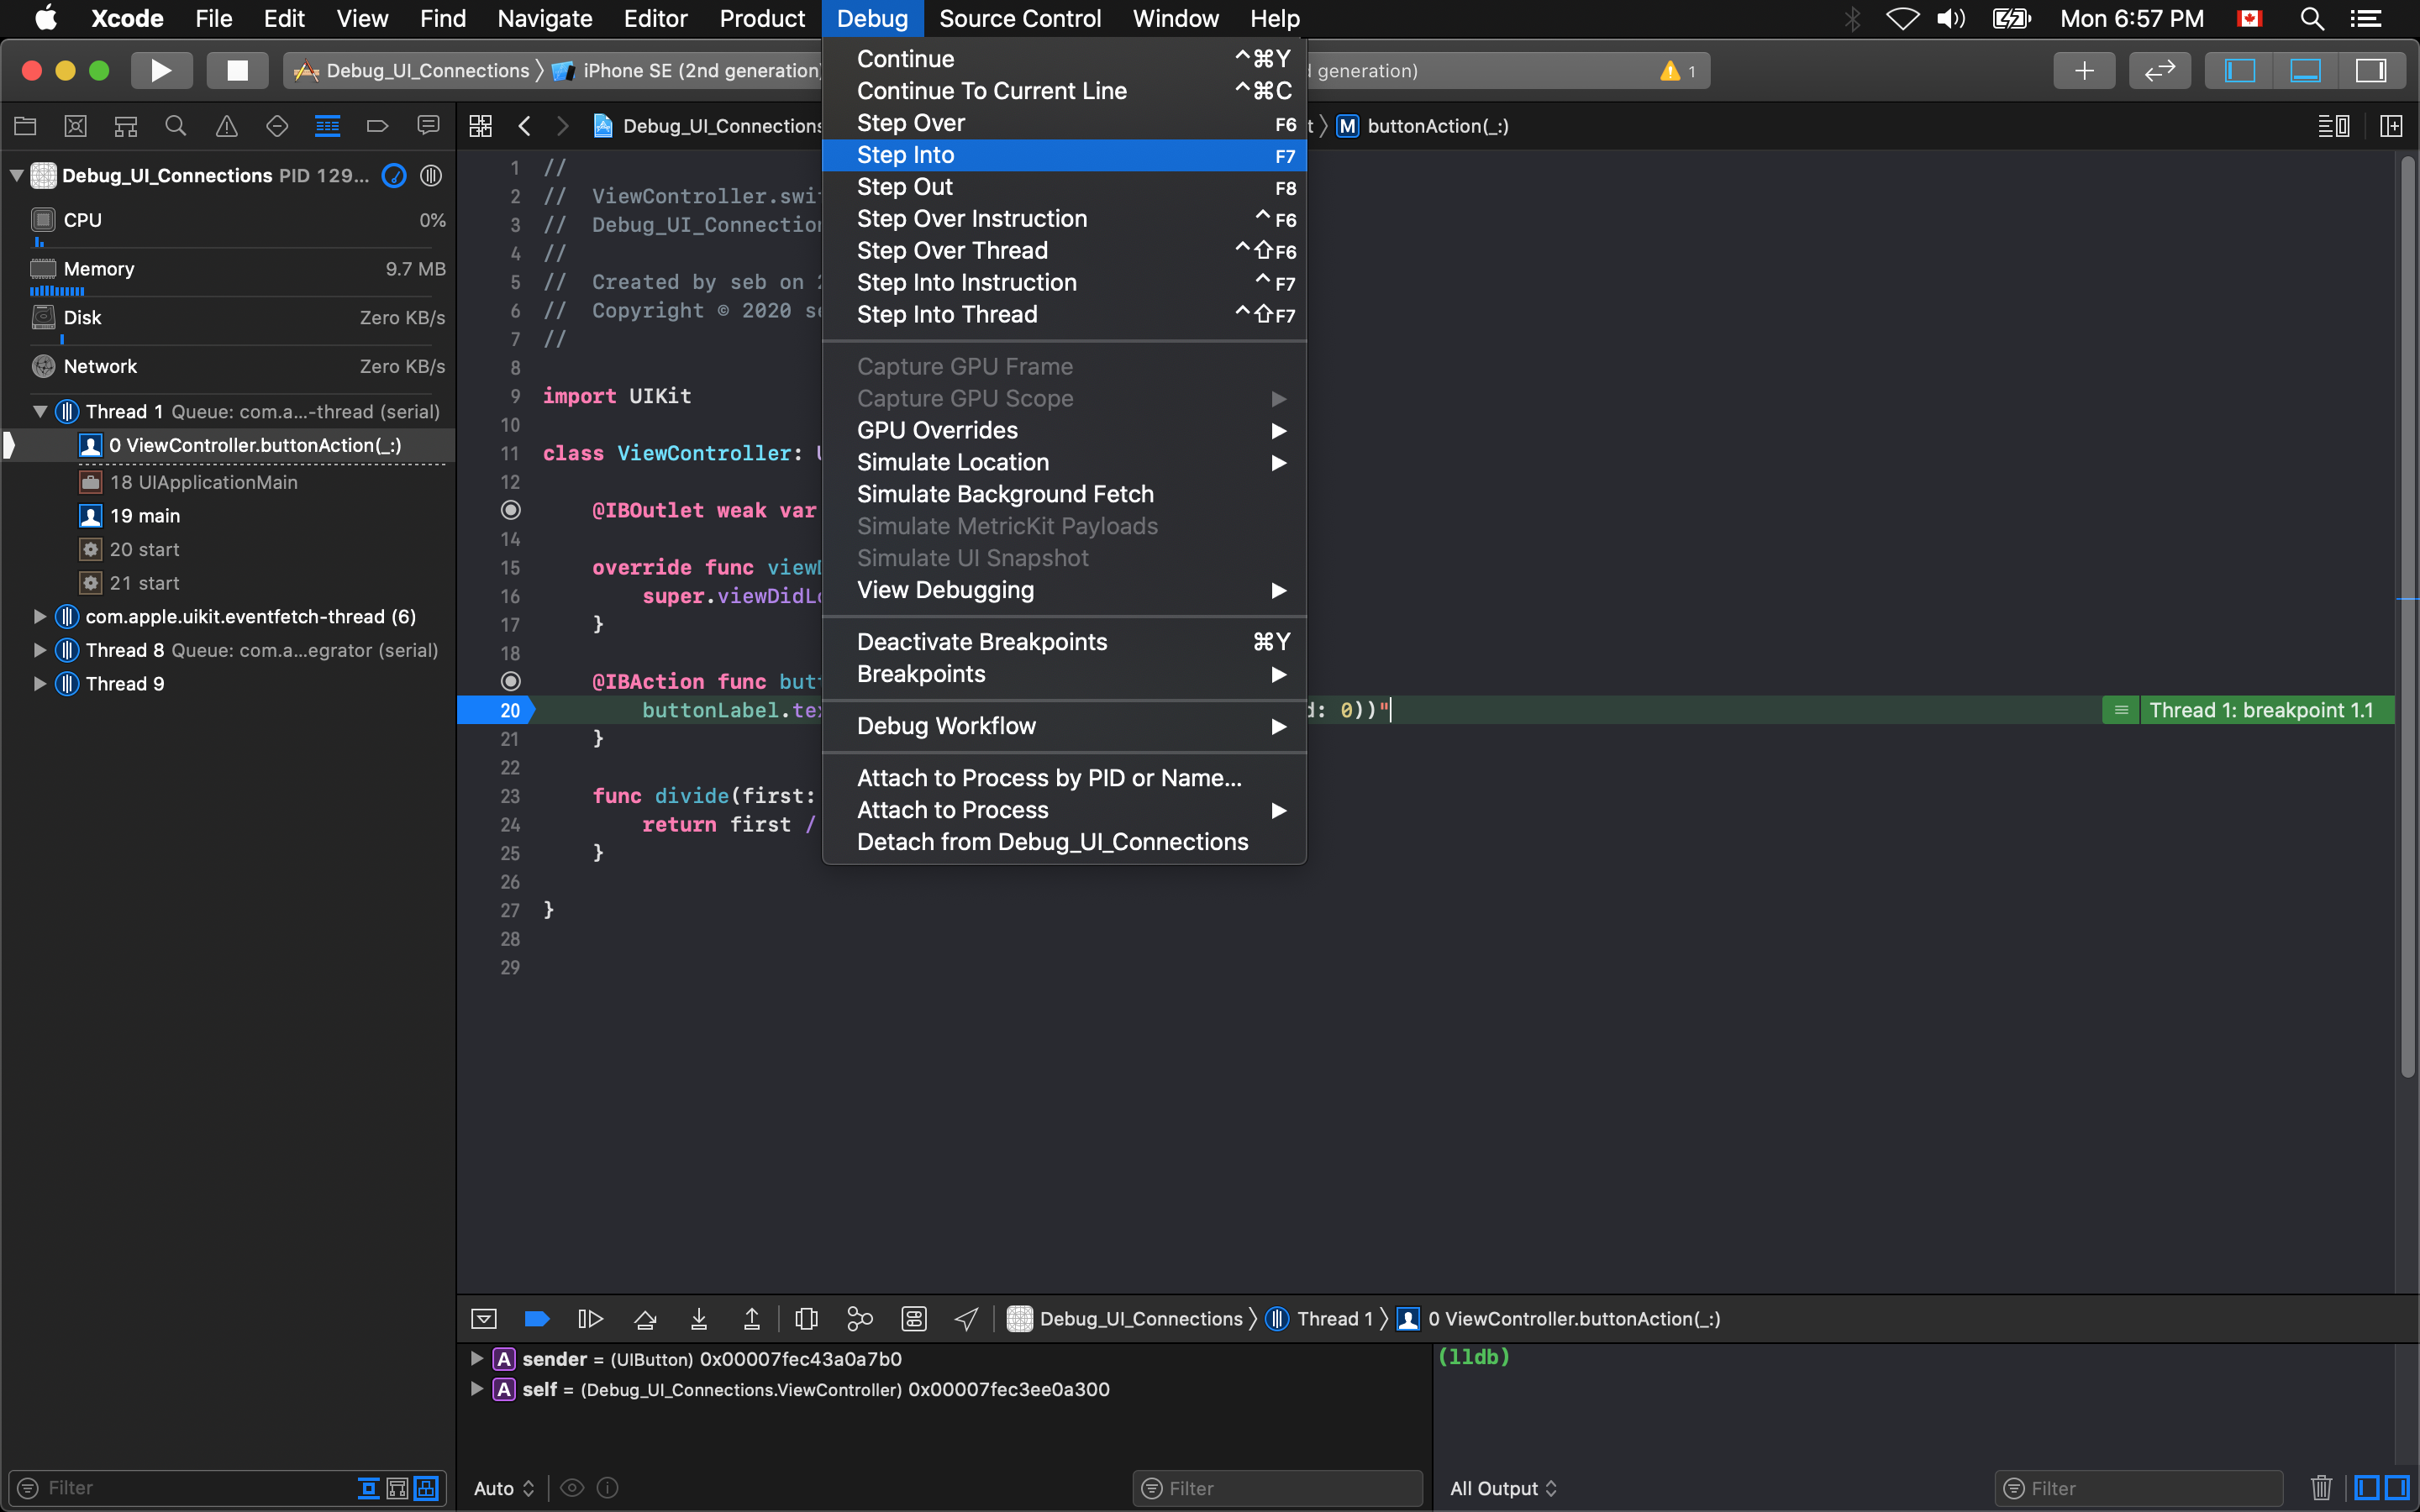
The Step Over option lets you go to the next line of code in the current scope of your code. Step Into will go into and halt on the next line of code in any functions that is called at the current break-point. If we step-into, we will end up inside the divide function and get to the line of code that crashes.
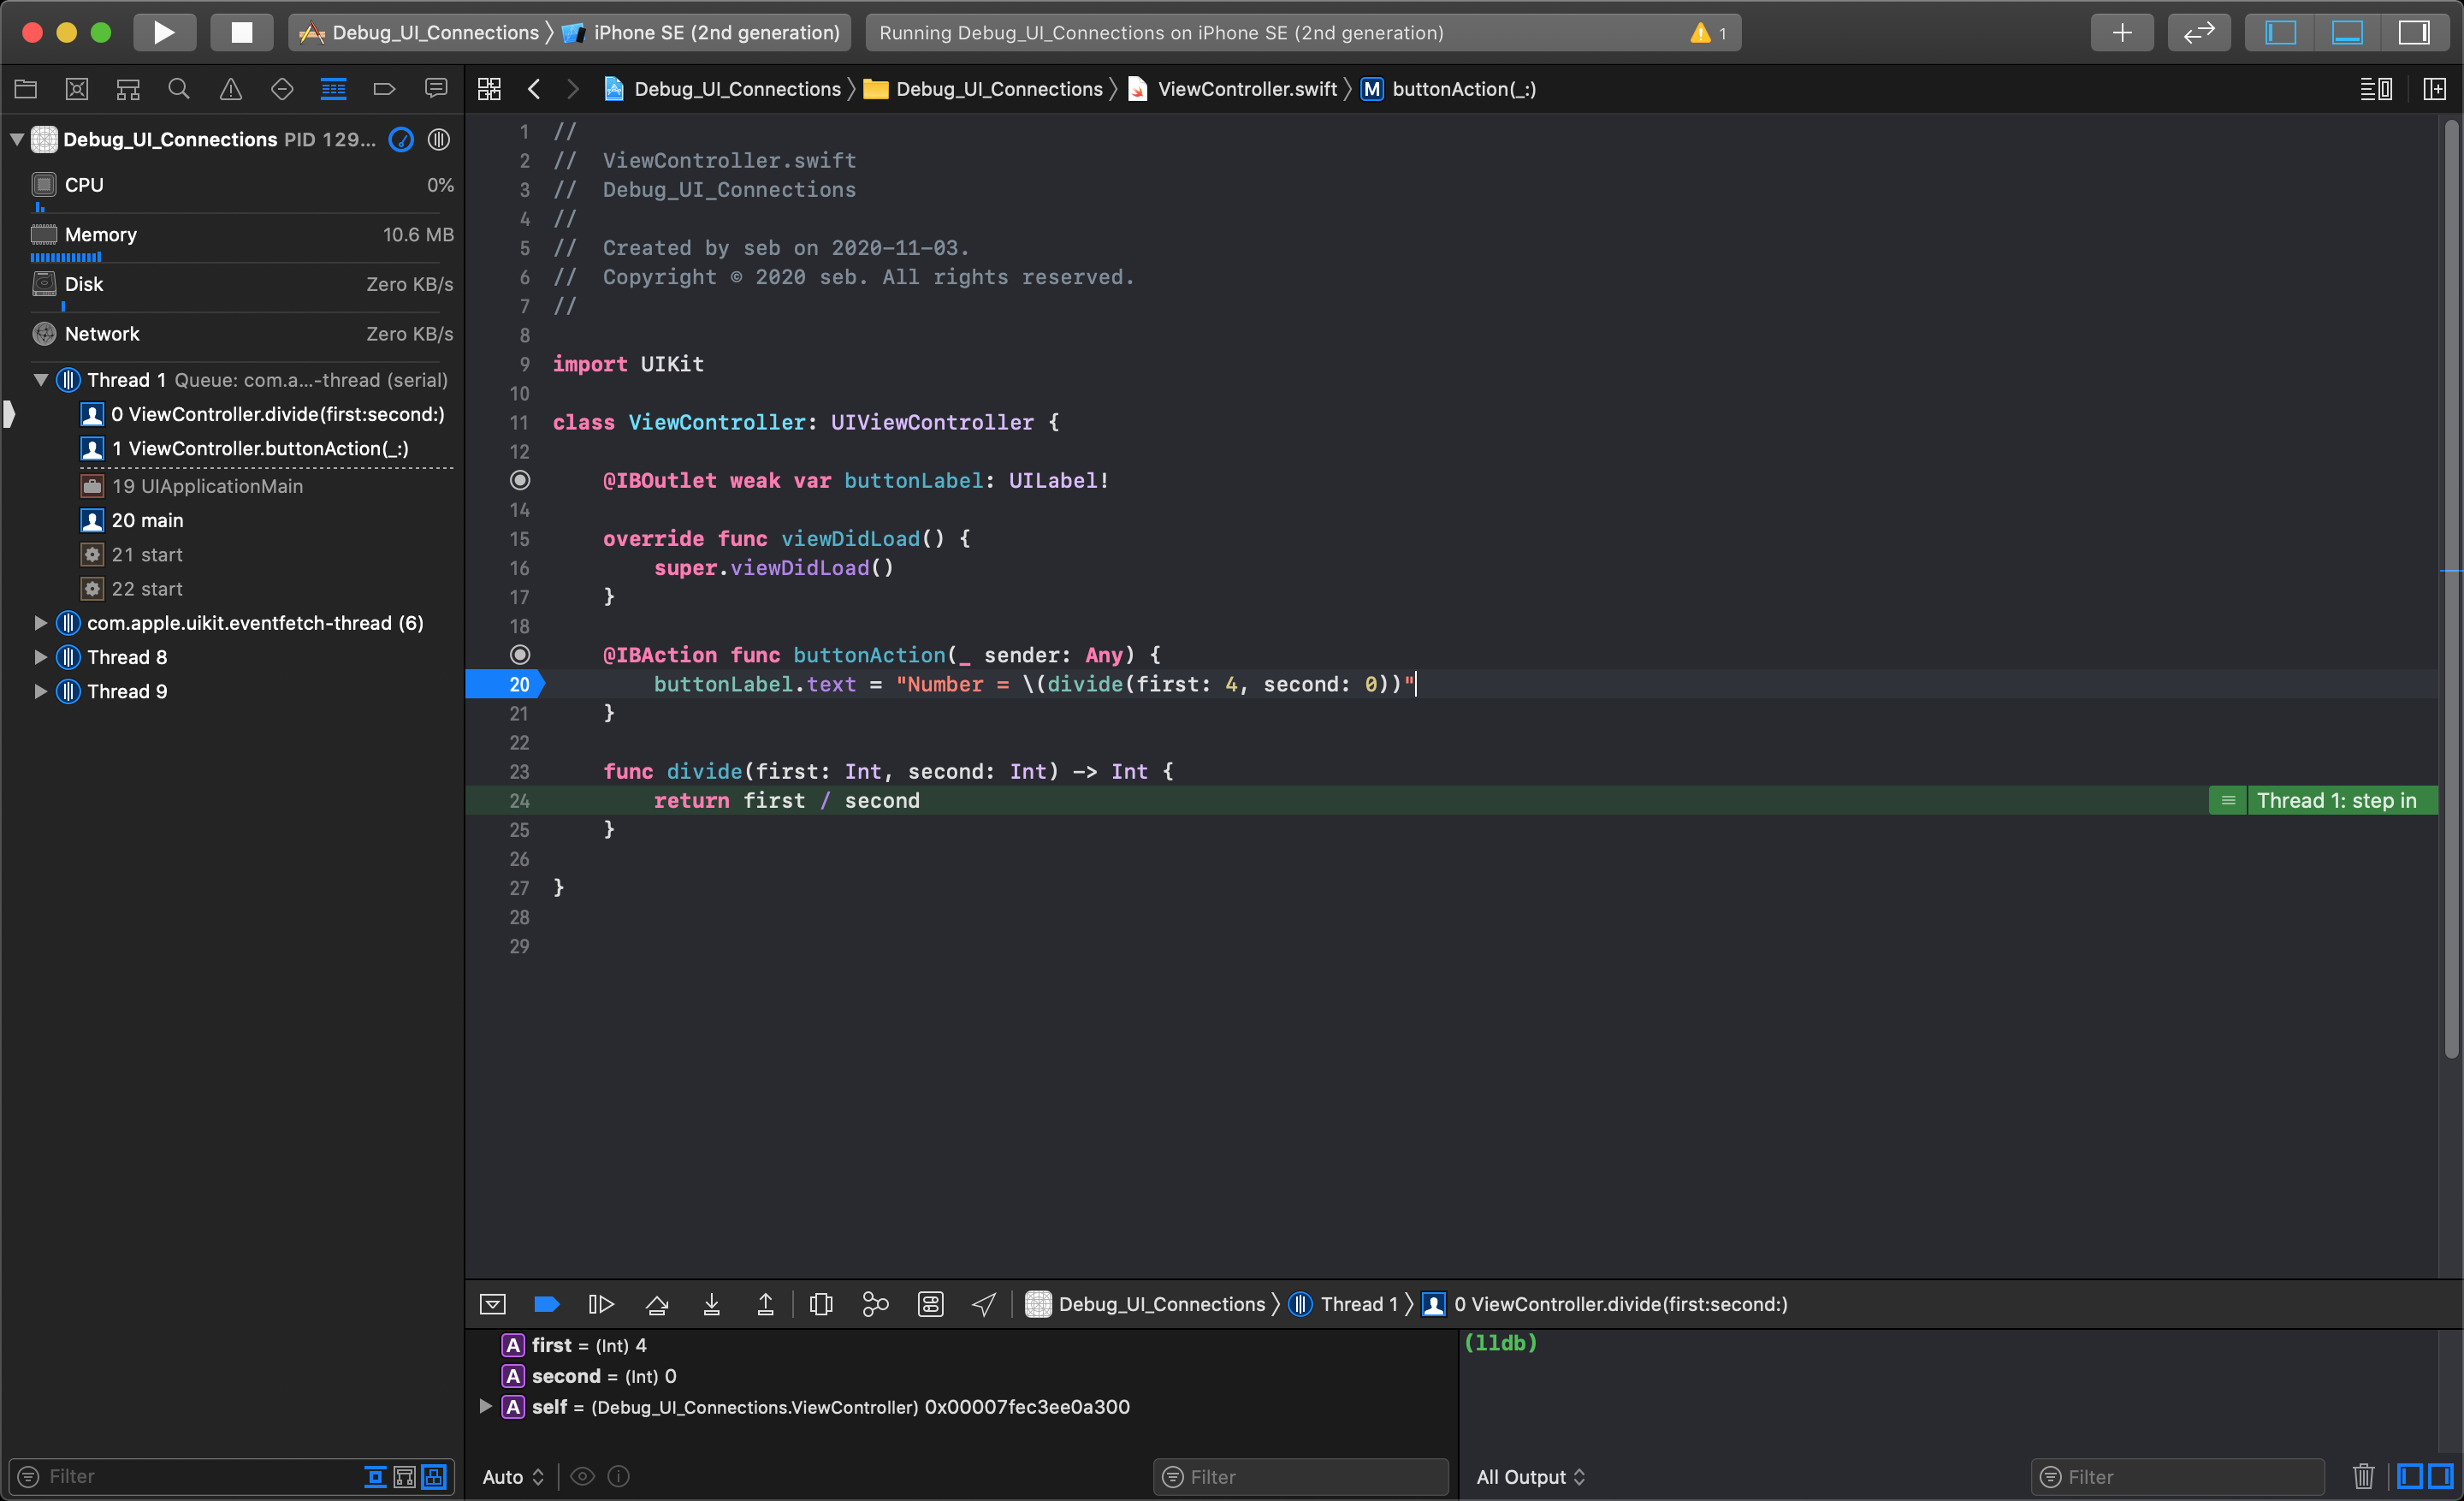
At every step of the application, we were able to look at the Variable View and see what each variable is set to, and we can see that the second parameter variable is set to 0 on line 21 when the function is called.
By investigating, we found that the application was crashing on line 25 when the division math operator could not divide by 0 and were able to work back to find the exact line of code that was causing the crash.
To learn how to use break-points to debug code errors in your iOS application, watch the following video:
iOS 10 App Development Essentials 4: Application Architecture - How to use the debugger